Continuing the series with the eBPF development ecosystem and a step by step guide on writing a simple eBPF application.
As we’ve mentioned in our introduction post to the series, in this part we take a look at various projects that enable easier development and maintenance of BPF programs. We will offer a short overview of BPF CO-RE and why we use it to develop BPF programs. Next, we will show a simple BPF system call tracing application focusing mainly on observability hooks.
A quick look at the BPF development ecosystem
Generally, there are two main parts of any BPF application the BPF program, written in a pseudo-C language that is valid for such programs, and a userspace part which you can write in any language. The BPF program is compiled into BPF bytecode and prepared for loading into the kernel. The most minimal userspace application will then be just a loader that loads the bytecode and prepares it for execution.
However, userspace applications can do much more. The loader and BPF program usually communicate through BPF maps, which provide various data structures like hash maps, arrays and event-based structures. Data stored into the map by the BPF program is then retrieved in the userspace program, which can then do further processing, analysis and visualization, or whatever else a specific use case requires. Communication through maps can go in the other direction to allow runtime configuration of BPF programs. The figure below depicts the procedure of loading eBPF programs and reading from maps.
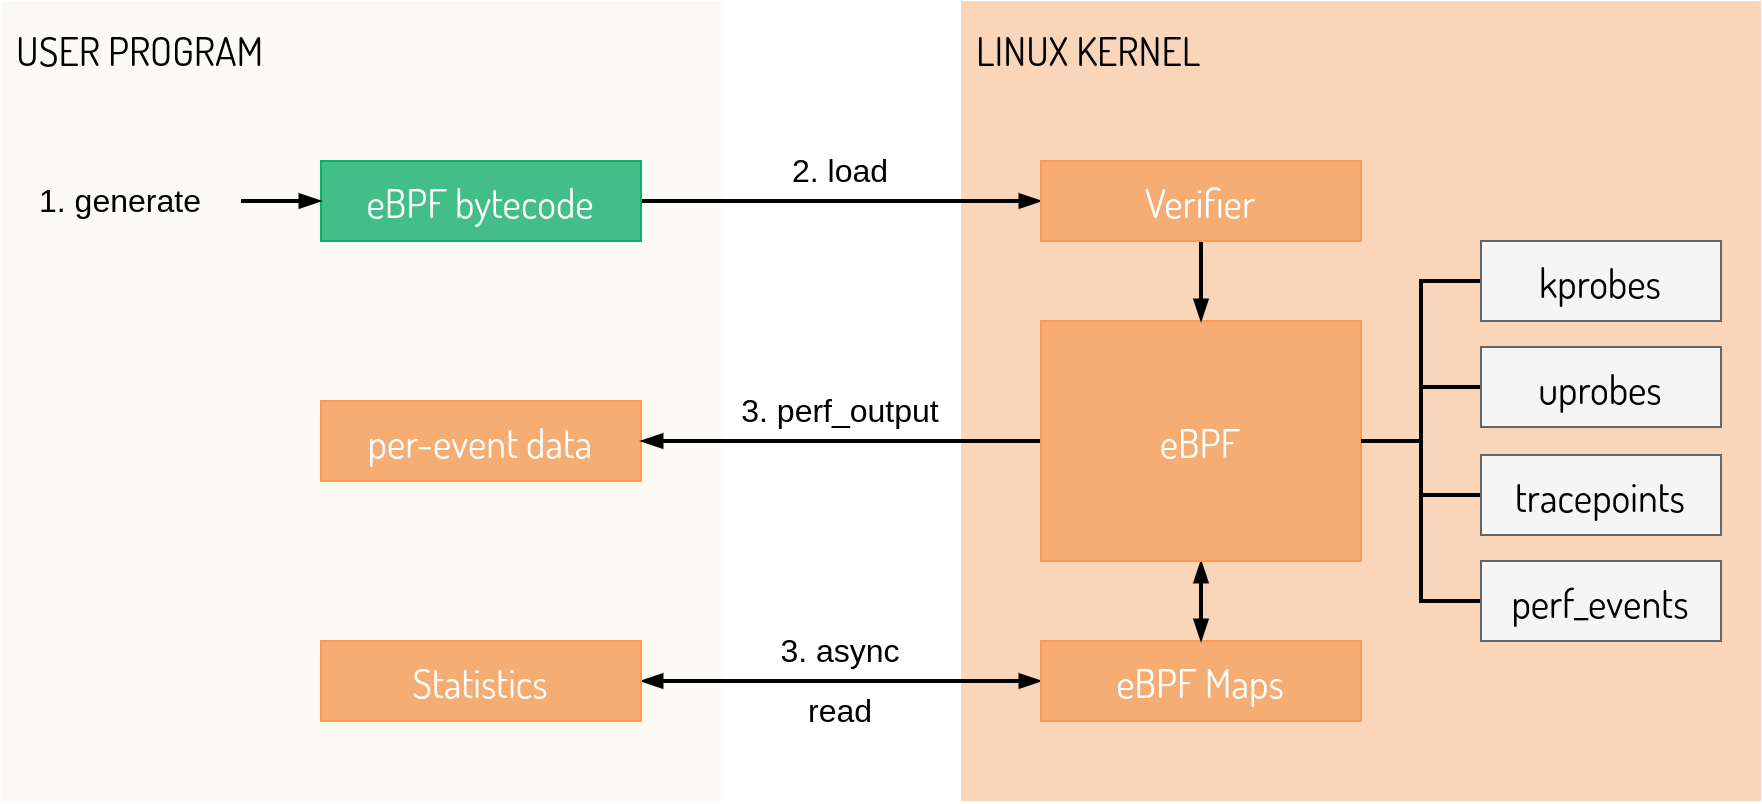
Source: programmersought.com
The most primitive way to load and work with BPF programs is to use the bpf system call. The system call takes a cmd argument which determines what type of operation will be performed by the call. To load the program, the user sets the cmd argument to BPF_PROG_LOAD and provides a structure containing the BPF bytecode and various metadata. Additionally, the bpf(2) system call can also load and manipulate maps. This way of working is really low-level, tedious and requires a lot of repetition. We will not go into further detail on this approach; some resources that cover it well are here and here.
Once eBPF was introduced into the kernel, developers began using it in various subsystems, which led to the development of multiple separate loaders. Tools such as perf, iproute and libbpf implemented slightly different BPF loaders based on the bpf(2) system call. This post will only cover libbpf because it is the most generic solution and served as the foundation for the BPF CO-RE project. The libbpf C library provides a collection of functions that enable easy building of userspace loaders, provide functions to load eBPF programs, load maps, set and retrieve data from maps and many more.
BCC
Until the introduction of CO-RE, the most popular way to develop BPF programs was BCC. BCC is a toolkit that allows users to develop loaders in Python (or front-ends in BCC terminology) with the BPF C source code embedded inside the Python application. The toolkit was a welcome change for many, as developing in a higher-level language than C is significantly quicker and easier. Any additional data processing done on the collected data was also made easier due to Python being a higher-level language.
In addition to being more approachable, BCC also tackled the issue of portability. As BPF programs run inside the kernel, they work within the kernelspace and with the kernel’s data structures. The glaring issue here is that memory layout and data structure definitions change between different kernel versions, between different architectures and even between different builds of the same version. Moreover, kernel structs can have their fields removed or renamed. The common way to deal with that was to have multiple BPF programs with conditionally defined struct access code based on the kernel configuration for which the program was built. This approach required projects to make available and include all different kernel headers for the desired target kernels. BCC freed developers from maintaining multiple BPF program versions and resolving the bugs that occur from maintaining these versions.
Achieving portability did not, however, come without drawbacks. BCC solves the portability issue by embedding BPF C code inside the Python program. When the Python script starts, it calls LLVM and compiles the BPF program locally, using locally available kernel headers. In other words, BCC employs “lazy” building by always building the code on the system where it will run. While this approach solves portability, it introduces a serious downside. LLVM is a large project consuming a lot of disk space and requiring significant resources to run. These requirements are particularly demanding when running BPF programs in an embedded or another limited environment. An additional inconvenience (albeit a lesser one) is the requirement to have kernel headers available locally.
BPF CO-RE
BPF CO-RE (Compile Once - Run Everywhere) has been in development for a while and was finally added to libbpf last year. To solve the afore-mentioned portability issues, BPF CO-RE required changes at multiple levels, primarily in the kernel, libbpf and Clang. The main change related to the kernel is the creation of the BPF Type Format (BTF). It is an alternative format to DWARF debug info with significantly reduced size, making it plausible to include such debug information in the kernel image. The debug information is exposed during runtime through the sysfs at /sys. Additionally, it enables generating a C header file with all the kernel data types, thereby making version-specific kernel headers unnecessary.
The extensions to Clang and libbpf work similarly to the way classic executable loaders work. Clang extensions add BTF relocations into the generated BPF ELF file to describe what kernel data various parts of the program are trying to access. The libbpf library then acts as a loader and processes the relocation data when loading and setting up the BPF program and maps. Additionally, libbpf resolves the relocations into concrete accesses for the kernel into which the BPF program is loaded. For more information about CO-RE and BTF, consult the following blog posts by CO-RE developers: BPF CO-RE, BTF deduplication and BCC to libbpf conversion guide.
An overview of possible BPF hook targets
Before we build our example application, we will first cover some rudimentary points at which you can attach BPF programs. During the BPF program loading, the userspace loader (libbpf in our case) also tells the kernel where to attach the program. There is a range of possibilities where BPF programs can attach, including XDP targets, Linux Security Modules (LSM) and various pre-existing observability technologies. For now, we will focus on the observability segment.
Numerous technologies developed over the past decades enable observability of kernel execution and state. Primary examples of these tools are kernel tracepoints and kprobes and user tracepoints and uprobes, all of which predated BPF. These technologies are used with a range of other tools, for example, manually through the debugfs (/sys/kernel/debug/tracing), with custom kernel modules, through perf and ftrace or various 3rd party tools like SystemTap and LTTng.
The main difference between tracepoints and probes from the user's perspective is that tracepoints (both user and kernel) are defined in the source and then compiled into the kernel or executable. Tracepoints also remain stable between different versions. On the other hand, kprobes and uprobes require no source modification and can be dynamically set onto any target code. However, if the target code changes between versions, the tracing program using kprobes will have to be updated to work with the new version.
The kernel comes with plenty of existing tracepoints already defined in /sys/kernel/debug/tracing/events/, where all traceable syscalls are visible in /sys/kernel/debug/tracing/events/syscalls. In this example, we will trace system call entry by using tracepoints. For a more detailed introduction to Linux tracing, consult the respective Linux kernel documentation page or this blog post. The LWN.net news site also contains great introductory pieces on the topics of tracepoints and kprobes.
Developing a simple BPF CO-RE application
There are several prerequisites we have to meet before developing our first BPF CO-RE application. First, we must verify that the kernel is built with BTF info, which can be done by enabling kernel config options CONFIG_DEBUG_INFO=y and CONFIG_DEBUG_INFO_BTF=y. Building the kernel with these options makes the binary BTF info available in /sys/kernel/btf/vmlinux. Later on, we will use this binary BTF info to generate the vmlinux.h header, which replaces the old kernel headers that users had to include. Several other kernel options might be required depending on the BPF application. For example, a BPF application making use of kprobes would require enabling CONFIG_KPROBES=y. Additionally, some options might not be available depending on the target architecture, and some might need to be disabled. We will cover more details about architecture-specific configuration and issues in a future post in this series.
Our example application will try to track all the invocations of the execve system call on the system. We based some parts of this example on the BCC libbpf-tools execsnoop example (libbpf-tools examples and libbpf-bootstrap are excellent resources to get started with BPF development). The complete code for this example is available on our GitHub.
We can start by writing a BPF program that first attaches to the execve system call. The usual convention is to add a .bpf.c postfix to such files. A starting example looks something like this:
 #include "vmlinux.h"
 #include <bpf/bpf_helpers.h>

 SEC("tracepoint/syscalls/sys_enter_execve")
 int tracepoint__syscalls__sys_enter_execve(struct trace_event_raw_sys_enter *ctx)

 {
    return 0;
 }

 char LICENSE[] SEC("license") = "GPL";
The first line includes the vmlinux.h header generated from /sys/kernel/btf/vmlinux. At this point, we can go ahead and generate the file, for which we will need bpftool. This tool should be available on most Linux distributions, but you can also build it from source. Once we have bpftool, we can generate vmlinux.h:
~ $ bpftool btf dump file /sys/kernel/btf/vmlinux format c > vmlinux.h
One of the advantages of CO-RE is that this file rarely has to be regenerated, as libbpf will adjust the program with regards to any kernel differences during load time (thus the name Compile Once - Run Everywhere). However, if we were to cross-compile this for a non-x86 architecture, we would most likely need another vmlinux.h header generated on a system with the matching architecture.
As mentioned in the previous post, there are some limitations when writing BPF programs in C. First of all, each BPF program can consist of only one function where calls to other functions are not allowed, at least not in the usual way. The bpf_helpers.h header includes a set of BPF kernel helper functions that manipulate maps, deal with accesses through userspace pointers, retrieve information about the current process and so on. For a full list of available functions, consult the bpf-helpers manpage. For our sample application, the bpf_helpers header defines the SEC macro, which in turn places the function below into a special ELF section to let libbpf know where to attach the BPF program. The bpf_helpers.h header comes included with libbpf.
We can see that the SEC macro specifies a path, SEC("tracepoint/syscalls/sys_enter_execve"). If we look at the /sys/kernel/debug/tracing/events directory, we can see that the syscalls/sys_enter_execve parts match. A simple way to find a matching event to attach the BPF program is to look in the /sys/kernel/debug/tracing directory. In other words, this will attach the BPF program to the execve syscall and trigger the BPF program on system call entry.
Next we can take a look at the BPF program function definition: int tracepoint__syscalls__sys_enter_execve(struct trace_event_raw_sys_enter *ctx). While the function name can be arbitrary, a good practice is to follow conventions like this for readability purposes. The argument that the function receives is a generic argument received by functions that attach to system call entry points. The argument is defined in the vmlinux.h header and looks like this:
 struct trace_event_raw_sys_enter {
    struct trace_entry ent;
    long int id;
    long unsigned int args[6];
    char __data[0];
 };
A matching structure for syscall exit is struct trace_event_raw_sys_exit.
Right now, our program simply returns 0 (every BPF program must return an integer). In our sample application we can afford to ignore the return value and return 0. However, some program types like XDP BPF programs use the return value. When execution ends, the BPF program returns the integer value to the kernel, which then decides what action to take based on the returned value (e.g., drop or forward a network packet).
Finally, the last line declares the license of the BPF program. In most cases, this will be GPL since non-GPL BPF programs are pretty limited. A large portion of bpf-helper functionality is GPL-licensed, so not setting the license section to GPL means that you cannot use any of those helpers, thereby significantly limiting what the programs can do.
We can compile the program with the following command:
~ $ clang -g -O2 -target bpf -D__TARGET_ARCH_x86_64 -I . -c hello.bpf.c -o hello.bpf.o
Use Clang for now since BPF target support was just initially added to the LLVM project. GCC support has been in the works for some time. For demonstration purposes, we can add another line before the return statement: bpf_printk("Hello world!\n");
This line uses a macro defined in bpf_helpers.h that prints formatted output to the system's trace pipe in /sys/kernel/debug/tracing/trace_pipe. Now we can start writing the userspace loader. First, we will need a utility function used to read from the trace pipe:
 void read_trace_pipe(void)
 {
    int trace_fd;

    trace_fd = open("/sys/kernel/debug/tracing/trace_pipe", O_RDONLY, 0);
    if (trace_fd < 0)
      return;

    while (1) {
      static char buf[4096];
      ssize_t sz;

      sz = read(trace_fd, buf, sizeof(buf) - 1);
      if (sz > 0) {
        buf[sz] = 0;
        puts(buf);
      }
    }
 }
Next we can add some header inclusions:
 #include <sys/types.h>
 #include <sys/stat.h>
 #include <fcntl.h>
 #include <unistd.h>

 #include <bpf/libbpf.h>
 #include <bpf/bpf.h>
The bpf/bpf.h and bpf/libbpf.h headers are libbpf headers for userspace applications. The bpf.h header defines various userspace bpf helpers for working with BPF programs and maps. The bpf/libbpf.h header includes libbpf types and functions.
The next header to include is #include "hello.skel.h". This header is a program-specific header generated from the compiled BPF object file. The generated skeleton contains a collection of functions and data structures to help load the BPF program and work with its maps. It also contains a generated structure that describes the program that will be loaded. Use the following command to generate the skeleton header:
$ bpftool gen skeleton hello.bpf.o > hello.skel.h
The first step then is to define the hello_bpf object and open, load and attach the program:
 struct hello_bpf *obj;
 int err = 0;

    obj = hello_bpf__open();
    if (!obj) {
      fprintf(stderr, "failed to open and/or load BPF object\n");
      return 1;
    }

    err = hello_bpf__load(obj);
    if (err) {
      fprintf(stderr, "failed to load BPF object %d\n", err);
      goto cleanup;
    }

    err = hello_bpf__attach(obj);
    if (err) {
      fprintf(stderr, "failed to attach BPF programs\n");
      goto cleanup;
   }
All the generated skeleton code starts with hello_bpf_*. The open function opens and parses the BPF program, maps and global variables. The hello_bpf__load function then loads the program into the kernel, where it is verified. At this point, maps are initialized with starting values. Lastly, we attach the BPF program to our target hook point, a system call entry tracepoint. After attaching, the program will start running.
Since our program isn’t doing anything useful so far, the only thing we have to do is add a call to the read_trace_pipe function. After that we can clean up the program and exit:
    hello_bpf__destroy(obj);
    return err != 0;
Compile the program with:
~ $ clang -g -O2 -Wall -I . -c hello.c -o hello.o
This command will generate an object file which we still need to link with libbpf:
 ~ $ git clone https://github.com/libbpf/libbpf && cd libbpf/src/
 ~ $ make BUILD_STATIC_ONLY=1 OBJDIR=../build/libbpf DESTDIR=../build INCLUDEDIR=
 LIBDIR= UAPIDIR= install
Now we can build the actual executable:
$ clang -Wall -O2 -g hello.o libbpf/build/libbpf.a -lelf -lz -o hello
Finally, run the sample application with:
$ sudo ./hello
It is important to note here that BPF program loaders have to run as root.
It is highly likely that error output like this will appear:
 libbpf: elf: skipping unrecognized data section(4) .rodata.str1.1
 libbpf: Error in bpf_object__probe_loading():Operation not permitted(1). Couldn't load
    trivial BPF program. Make sure your kernel supports BPF (CONFIG_BPF_SYSCALL=y) and/or
    that RLIMIT_MEMLOCK is set to big enough value.
 libbpf: failed to load object 'hello_bpf'
 libbpf: failed to load BPF skeleton 'hello_bpf': -1
 failed to load BPF object -1
To fix that, we need to set appropriate rlimits:
 struct rlimit rlim = {
    .rlim_cur = 512UL << 20,
    .rlim_max = 512UL << 20,
 };

 err = setrlimit(RLIMIT_MEMLOCK, &rlim);
 if (err) {
    fprintf(stderr, "failed to change rlimit\n");
    return 1;
 }
You can check the program's output by catting /sys/kernel/debug/tracing/trace_pipe. The output should look like this:
 bash-20959 [004] ...3 27966.607434: 0: Hello world!
 i3-20961 [003] ...3 27968.801800: 0: Hello world!
 sh-20961 [003] ...3 27968.807215: 0: Hello world!
 i3-sensible-ter-20961 [003] ...3 27968.812403: 0: Hello world!
 alacritty-20968 [006] ...3 27968.967502: 0: Hello world!
 bash-20974 [006] ...3 27968.984014: 0: Hello world
Extending the application with BPF maps
Now that we have an actual working BPF application, we might as well extend it to do something more useful. Instead of just printing a hello world message into the trace pipe, we can store the arguments of the execve system call for further processing and analysis. To achieve this, we will use BPF maps.
BPF maps are generic data structures for storing different types of data. They can be shared and accessed by multiple BPF programs. Many maps are key-value based, while some are event-based, meaning that the userspace polls the maps and receives an event when new data is added to the map. Maps are handled through file descriptors in userspace programs.
To start with the hello.bpf.c example, we will create a new one in maps.bpf.c and add a map definition there:
 struct {
    __uint(type, BPF_MAP_TYPE_HASH);
    __uint(max_entries, 128);
    __type(key, pid_t);
    __type(value, struct event);
 } execs SEC(".maps");
The above snippet defines a hash map that works like a hash table. It has a maximum of 128 entries, where the key is the PID, and the value is a struct that will track execve arguments. When defining maps, it is important to place them in the ".maps" section so that the userspace loader can load and set up the maps properly. The event struct looks like this:
 #define TASK_COMM_LEN 16

 struct event {
    char comm[TASK_COMM_LEN];
    pid_t pid;
    uid_t uid;
 };
For now, we will store the PID, UID and the command line used to invoke the program. We will keep our BPF program from hello.bpf.c (tracepoint__syscalls__sys_enter_execve). Instead of printing to the trace pipe, we will create an event structure and fill it with data from the syscall:
 struct event *event;
 pid_t pid;
 u64 id;
 uid_t uid = (u32) bpf_get_current_uid_gid();

 id = bpf_get_current_pid_tgid();
 pid = (pid_t)id;
As shown in the above snippet, we first retrieve and fill in the UID and PID. The bpf_get_current_uid_gid and bpf_get_current_pid_tgid are bpf helper functions provided by the kernel. Their use isn't limited to just BPF programs attached to tracepoints or syscalls. Instead, users can utilize them to retrieve the PID and UID of the program triggering the hook for which the BPF program registered. Such usage of these helpers is common during program initialization.
Next, we check that an event for the same PID doesn’t already exist:
 if (bpf_map_update_elem(&execs, &pid, &((struct event){}), BPF_NOEXIST)) {
    return 0;
 }
This call succeeds if the event for the PID doesn’t exist and sets the value to an empty event.
Sometimes we would want to store multiple events for the same PID. For simplicity's sake, and because we are using a hash map, let's imagine that we want to capture only one exec event per PID. Next, we retrieve the entry associated with our current PID:
 event = bpf_map_lookup_elem(&execs, &pid);
 if (!event) {
    return 0;
 }
We fill in the event data:
 event->pid = pid;
 event->uid = uid;
 bpf_get_current_comm(&event->comm, sizeof(event->comm));
The bpf_get_current_comm helper is another kernel bpf helper that retrieves the command line and—in this case—stores it into &event->comm. Lastly, we update the value in the map:
 if (bpf_map_update_elem(&execs, &pid, event, BPF_EXIST )) {
    return 0;
 }
Regarding the userspace part, we will want to iterate through the map and print any data stored by the BPF program. To do that, we first retrieve the file descriptor associated with the map:
fd = bpf_map__fd(obj->maps.execs);
Here we can see how the skeleton file makes working with BPF programs a lot easier. The obj->maps structure contains all the maps associated with the opened BPF program. The following code will iterate through the map and print the data:
 int err;
 struct event ev;
 pid_t lookup_key, next_key;

 while (!bpf_map_get_next_key(fd, &lookup_key, &next_key)) {
    err = bpf_map_lookup_elem(fd, &next_key, &ev);
    if (err < 0) {
      fprintf(stderr, "failed to lookup exec: %d\n", err);
      return -1;
    }
    printf("\nProcess Name = %s, uid = %u, pid = %u\n", ev.comm, ev.uid, ev.pid);
    lookup_key = next_key;
 }
Here we can see that libbpf defines functions that work with BPF maps for userspace programs, with a similar interface to the kernel BPF helpers. The map iteration loop should continuously run inside a infinite loop until the program is interrupted.
At this point, it might be helpful to set up verbose libbpf logging to ease debugging:
libbpf_set_print(libbpf_print_fn);
The libbpf_print_fn callback is a user-defined callback used by libbpf to print useful information. The function looks like this:
 int libbpf_print_fn(enum libbpf_print_level level,
      const char *format, va_list args)
 {
    if (level == LIBBPF_DEBUG && !env.verbose) {
      return 0;
    }

    return vfprintf(stderr, format, args);
 }
Conclusion
In this post, we have introduced BPF CO-RE and walked you through writing a simple BPF system call tracing application. In our next post, we will build and run this example on a Raspberry Pi board using our Open Source builder Replica.one. During this procedure, we will highlight some issues that occur when working on non-x86 embedded systems.
Sartura offers a range of eBPF development, integration and education services, including custom eBPF application development and eBPF training and support. To find out more about our eBPF services, contact us at info@sartura.hr.
Want to keep in touch with the rest of this blog series? Consider subscribing to our newsletter below.